Recently, the 2025 Nobel Prize in Chemistry was awarded to Susumu Kitagawa, Richard Robson, and Omar Yaghi in recognition of “their development of metal–organic frameworks (MOFs).”
The three laureates created molecular structures with enormous internal spaces, allowing gases and other chemical species to flow through them. These structures, known as Metal–Organic Frameworks (MOFs), have applications ranging from extracting water from desert air and capturing carbon dioxide, to storing toxic gases and catalyzing chemical reactions.
Metal–Organic Frameworks (MOFs) are a class of crystalline porous materials formed by metal ions or clusters linked via organic ligands (Figure 1). Their structures can be envisioned as a three-dimensional network of “metal nodes + organic linkers,” combining the stability of inorganic materials with the design flexibility of organic chemistry. This versatile construction allows MOFs to be composed of almost any metal from the periodic table and a wide variety of ligands, such as carboxylates, imidazolates, or phosphonates, enabling precise control over pore size, polarity, and chemical environment.
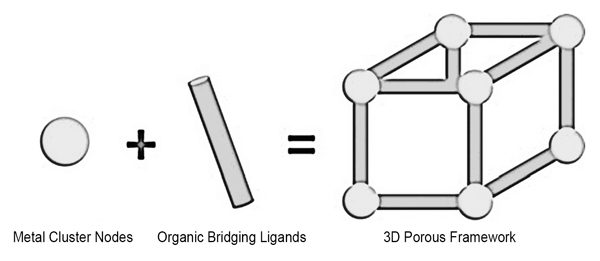 Figure 1. Schematic of a Metal–Organic Framework
Since the first permanent-porosity MOFs appeared in the 1990s, thousands of structural frameworks have been developed, including classic examples like HKUST-1 and MIL-101. They exhibit ultrahigh specific surface areas and pore volumes, offering unique properties for gas adsorption, hydrogen storage, separation, catalysis, and even drug delivery. Some flexible MOFs can undergo reversible structural changes in response to adsorption or temperature, showing dynamic behaviors such as “breathing effects.” Thanks to their diversity, tunability, and functionalization, MOFs have become a core topic in porous materials research and provide a solid scientific foundation for studying adsorption performance and characterization methods.
MOFs Characterization
The fundamental characterization of MOFs typically includes powder X-ray diffraction (PXRD) patterns to determine crystallinity and phase purity, and nitrogen (N₂) adsorption/desorption isotherms to validate the pore structure and calculate apparent surface area.
Other commonly used complementary techniques include:
-
Thermogravimetric Analysis (TGA): Evaluates thermal stability and can estimate pore volume in some cases.
-
Water Stability Tests: Assesses structural stability in water and across different pH conditions.
-
Scanning Electron Microscopy (SEM): Measures crystal size and morphology, and can be combined with energy-dispersive X-ray spectroscopy (EDS) for elemental composition and distribution.
-
Nuclear Magnetic Resonance (NMR) Spectroscopy: Analyzes overall sample purity and can quantify ligand ratios in mixed-ligand MOFs.
-
Inductively Coupled Plasma Optical Emission Spectroscopy (ICP-OES): Determines sample purity and elemental ratios.
-
Diffuse Reflectance Infrared Fourier Transform Spectroscopy (DRIFTS): Confirms the presence or absence of IR-active functional groups in the framework.
-
Single-Crystal X-ray Diffraction (SCXRD): Provides precise structural information.
Below is a brief overview of sample preparation and key data analysis points for each characterization method.
1. Powder X-ray Diffraction (PXRD)
PXRD determines the crystal structure and phase purity. Experimental diffraction patterns are compared with simulated patterns from single-crystal XRD data to confirm phase purity. Samples are typically measured as powders pressed into pellets or loaded into capillaries, with rotation applied during measurement to avoid preferred orientation effects. Peak broadening usually indicates small crystallite size rather than poor crystallinity.
2. Nitrogen Adsorption/Desorption Isotherms
N₂ adsorption/desorption isotherms, measured at 77 K, are used to confirm pore structure, calculate surface area and pore volume, and evaluate pore size distribution. To ensure reliable measurements, samples must be fully activated to remove solvents, and sample mass is critical — the product of sample mass (g) and specific surface area (m²/g) should typically exceed 100 m².
Surface area is calculated using the BET model. Accurate BET results depend on proper selection of the linear region of the isotherm following Rouquerol criteria. Incorrect selection can lead to several-fold deviations in surface area (Figure 2, Table 1). CIQTEK Climber series instruments feature automated BET point selection, eliminating human error and providing reliable results even for MOFs.
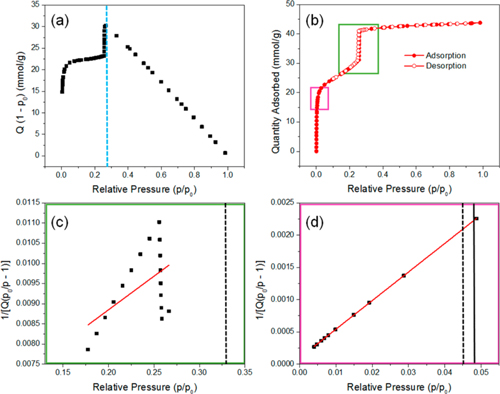 Figure 2. (a) Rouquerol plot indicating correct data points (left of dashed line); (b) N₂ adsorption/desorption isotherms showing intervals used for BET plots c (green) and d (pink); (c, d) BET plots with p/p₀ ranges 0.17–0.27 and 0.004–0.05, respectively. Solid lines correspond to n(m) at p/p₀ (Rouquerol criterion iii), dashed lines correspond to 1/√C + 1 (criterion iv).
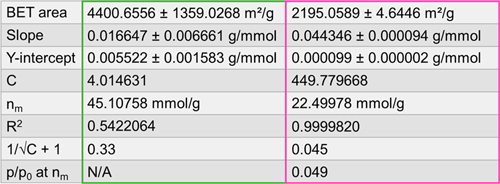 Table 1. BET areas, slopes, intercepts, C constants, monolayer capacities n(m), R², 1/√C + 1, and corresponding p/p₀ values for plots c and d in Figure 2.
3. Thermogravimetric Analysis (TGA)
TGA evaluates thermal stability and can roughly estimate pore volume based on solvent loss. The decomposition behavior depends strongly on the carrier gas (N₂, air, O₂), which should be noted in reports. Combining TGA with variable-temperature PXRD or adsorption experiments can verify structural stability after thermal treatment.
4. Scanning Electron Microscopy (SEM)
SEM observes crystal morphology and size, and can be combined with EDS for elemental analysis. Since MOFs are often insulating, charging artifacts can occur, usually mitigated by coating with a conductive layer (e.g., Au or Os). Accelerating voltage affects resolution and surface details: higher voltages yield clearer crystal outlines but may damage surface features. For EDS quantification, coating elements should be considered to avoid overlapping signals with target metals.
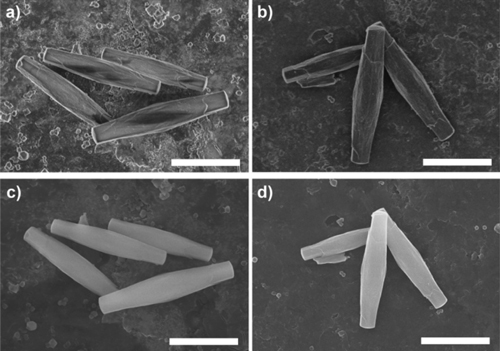 Figure 3. SEM images of PCN-222(Fe): with Os coating (a, c) and without coating (b, d), at 2 kV (a, b) and 15 kV (c, d). Scale bar: 5 μm.
5. Other Complementary Techniques
-
ICP-OES/MS: Quantifies metal ratios and detects impurities or leaching; samples must be fully dissolved via acid digestion.
-
NMR Spectroscopy: Dissolution NMR measures ligand ratios, residual modulators, and solvent removal; solid-state NMR probes ligand environments and molecular interactions.
-
DRIFTS: Confirms characteristic functional groups in the framework and studies adsorption under gas flow or variable temperatures.
Combining multiple characterization methods provides a comprehensive view of MOFs’ structure, porosity, and composition, offering reliable support for performance analysis and mechanistic studies.
References:
- Rouquerol, F. et al., Adsorption by Powders and Porous Solids: Principles, Methodology and Applications, Chapter 14, Academic Press, 2015.
- Howarth, A. J. et al., Chem. Mater. 2017, 29, 26–39. DOI: 10.1021/acs.chemmater.6b02621